Popular Chart Patterns
Explore the various technical chart patterns used in trading:
Head and Shoulders
The Head and Shoulders pattern is a reliable reversal pattern that forms after a strong uptrend. It indicates a weakening of the trend and often signals a shift in direction towards a downtrend.
Double Top
The Double Top pattern is a bearish reversal chart pattern that typically forms after a strong upward trend. It signifies that the price is struggling to move higher after reaching a resistance level twice.
Double Bottom
The Double Bottom pattern is a bullish reversal pattern that forms after a downtrend. It suggests that the price has found support at a specific level twice, signaling potential upward movement.

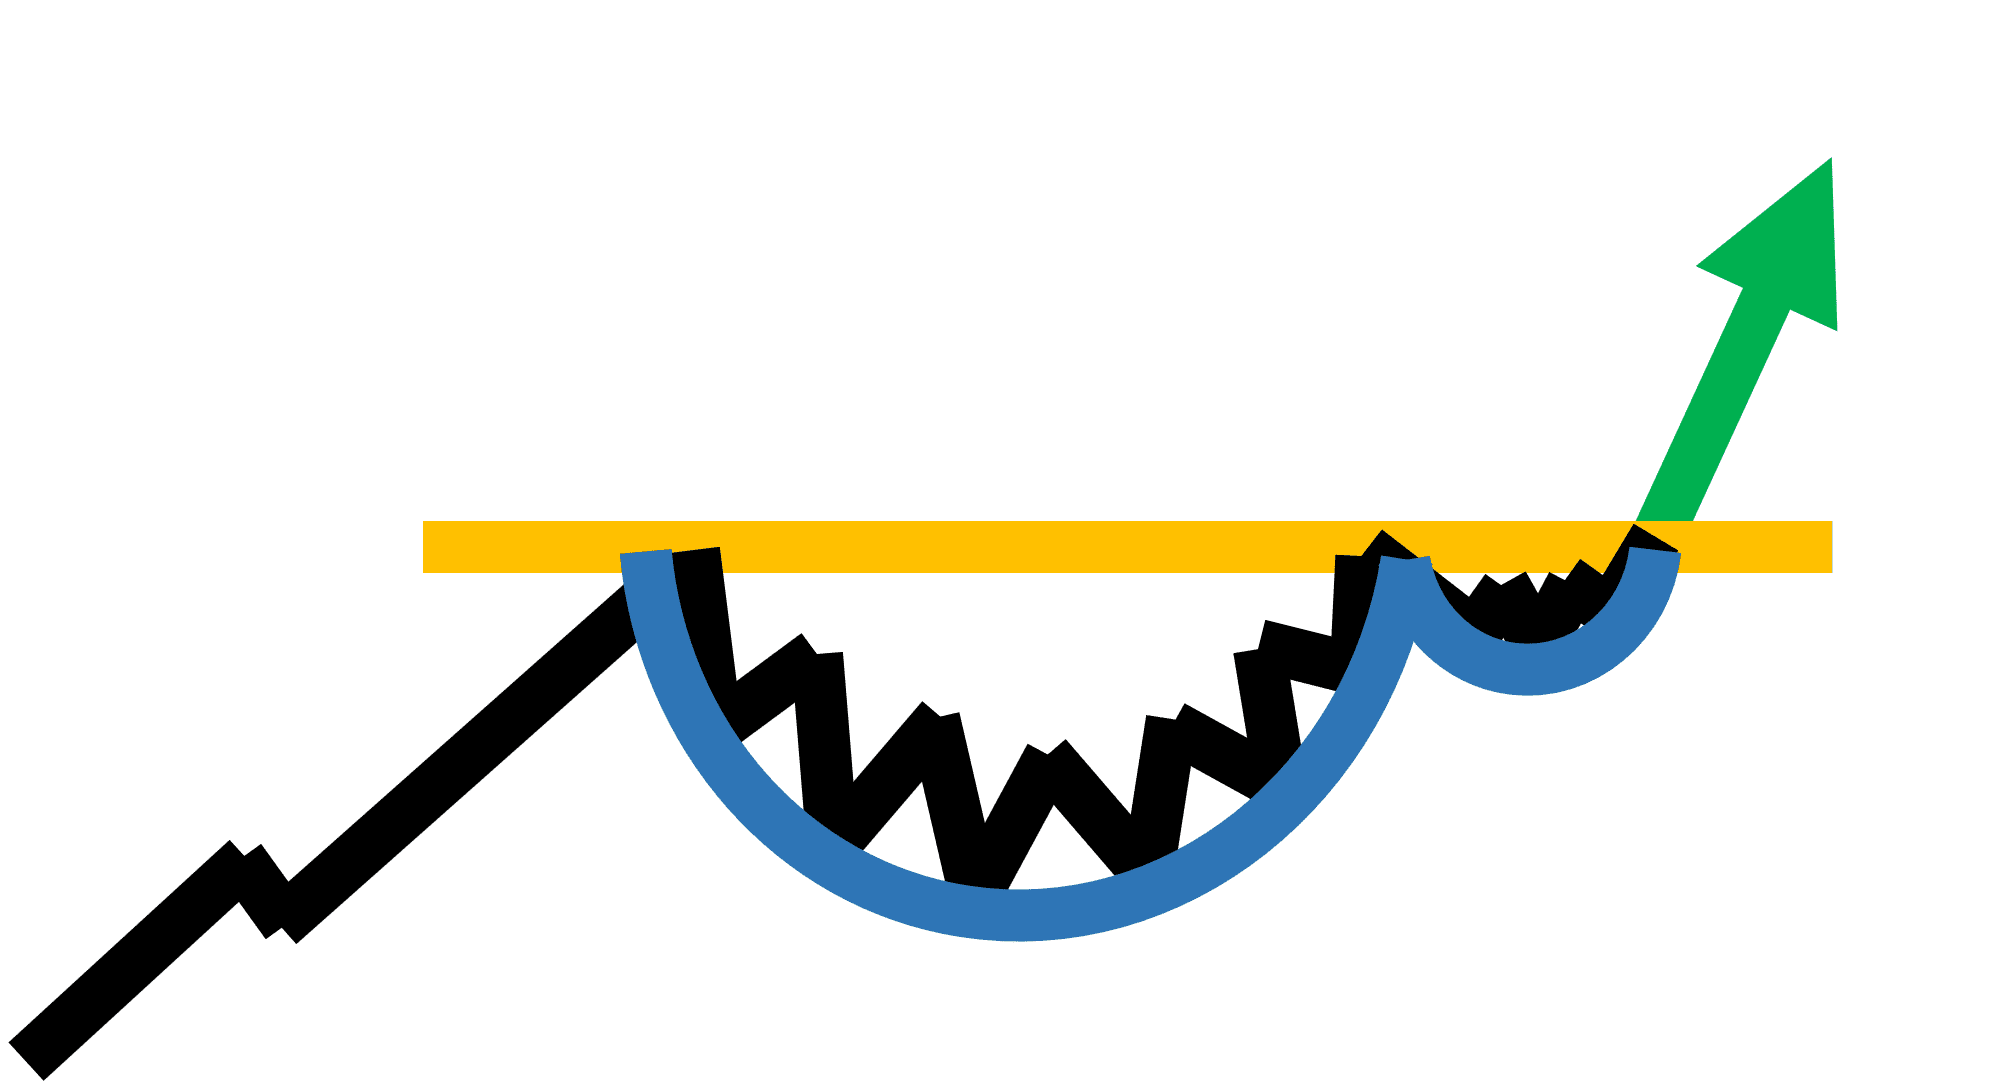
Cup and Handle
The Cup and Handle pattern is a bullish continuation pattern that resembles a cup with a handle. It signifies a consolidation phase before a breakout to the upside.
Ascending Triangle
The Ascending Triangle pattern is a bullish continuation pattern. It shows that buyers are gaining strength as the price forms higher lows, pushing towards a resistance level.
Descending Triangle
The Descending Triangle pattern is a bearish continuation pattern. It indicates that sellers are gaining control as the price forms lower highs and is often seen as a sign of potential downward movement.
Symmetrical Triangle
The Symmetrical Triangle pattern indicates a period of consolidation before a breakout. It can lead to either a bullish or bearish trend depending on the breakout direction.

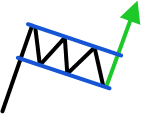
Flag Pattern
The Flag pattern is a continuation pattern that resembles a rectangle. It forms after a strong price movement and indicates that the price may continue in the same direction after a brief consolidation.
Pennant Pattern
The Pennant pattern is a continuation pattern that forms after a strong price movement. It typically signals a short period of consolidation before a breakout in the same direction as the previous trend.
Wedge Pattern
The Wedge pattern is a reversal or continuation pattern that can signal a potential trend change. It forms when the price consolidates within converging trend lines.
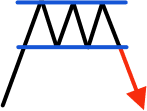
Rectangle Pattern
The Rectangle pattern may act as a reversal or a continuation pattern that occurs when the price moves sideways between horizontal support and resistance levels. It indicates indecision in the market.

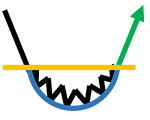
Rounding Bottom
The Rounding Bottom pattern is a long-term bullish reversal pattern. It indicates a gradual change in trend from bearish to bullish over a longer period.

Triple Top
The Triple Top pattern is a bearish reversal pattern that forms after an uptrend. It occurs when the price reaches a resistance level three times before reversing.

Triple Bottom
The Triple Bottom pattern is a bullish reversal pattern that forms after a downtrend. It occurs when the price hits a support level three times before reversing.